
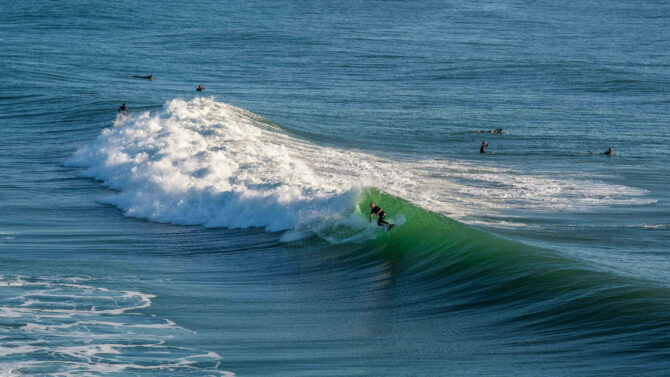
Another model to improve accuracy? Yes please. Photo: John de Costa

There’s a new acronym doing the rounds in surf forecasting circles. And it could help you score way more waves. It’s called GEFS (Global Ensemble Forecasting System), and while it’s been quietly running in the background of weather models for over three decades, it’s more recently been put to work for surfers.
“The GEFS is based on what forecasters call an ‘ensemble’; the model is run many times with slightly different starting points, giving a different way of reading the same ocean.” Rob Davies, Surf-Forecast’s Chief Forecaster, told The Inertia. Previously, the GFS (Global Forecast System) was the deterministic model most surf forecasts have leaned on for years. It runs once, from one best-guess set of starting conditions, and gives you a single answer. As Rob puts it, “GFS uses higher spatial resolution, capturing some local effects more accurately.” He reckons that checking conditions inside a week creates a sharpness that makes it the model to trust first.
GEFS however, runs the same model 31 times, each with the starting conditions nudged slightly, and shows you the spread. Its edge isn’t sharpness; it’s honesty about the second week. Rob again: “The range model analyzes a distribution of possible outcomes, which improves reliability of the long range part of the forecast.” It also runs at finer time steps, which matters more than it sounds. “With true hourly detail rather than values estimated between three-hour intervals, which can make it a sharper read when conditions are changing quickly,” he says.
It’s not exactly new. The US National Centers for Environmental Prediction first ran GEFS in December 1992, with a modest three-member ensemble at low resolution. Resolution is key in surf forecasting. It represents the distance between data points in a computer model. Low-resolution models might have grid cells that are 25 to 50 miles apart, which could miss local blocks or shadows cast by nearby points and cliffs, meaning every spot in a large zone shares the exact same wave prediction. High-resolution models shrink the distance between nodes down to a few miles, capturing how local headlands, underwater canyons, islands, and specific local winds affect a single surf break.
For years however, the GEFS stayed a background tool, mostly used to hedge rainfall and temperature forecasts. By the mid-2000s it had grown to 20 perturbed members plus one control, cycling every six hours.
The real step change for surfers came with the intro of GEFSv12 around 2020: the ensemble expanded to 31 members running four times a day at 0.25° resolution. That’s a grid where each square measures 0.25 degrees by 0.25 degrees of latitude and longitude, or 17 by 17 miles. And for the first time, wave modeling was coupled directly into the ensemble rather than bolted on afterwards. That’s the point GEFS stopped being purely an atmospheric tool and became genuinely useful for swell.
On the Surf-Forecast site, they have just added the GEFS model as a tool for subscribers. You can toggle between the standard GFS model and GEFS for the same break and check out what each model predicts.
“Think of it as a second opinion,” says Rob. “Most of the time the two views will broadly agree. When they do, you can plan with more confidence. When they disagree, that’s a sign the outlook is genuinely uncertain, and worth checking again closer to the day.”
Surfline hasn’t sat still on this either. Their forecasts run on a proprietary in-house model built on high-res bathymetry mapping and nearshore wave physics, backed by a forecasting team who lean on human judgement over raw model output. They use both models to present their forecasts in an easy to understand way.
Take Lower Trestles in a borderline swell window, the kind of long-period groundswell that can either fill in beautifully or fizzle out a foot short of what everyone hoped for. Nine days out, GFS might show a clean four-foot swell. On its own, that reads as a lock. Pull up GEFS on the same window and you might find 70 percent of the 31 members agree on four-foot or better, with the rest scattered lower. That’s a genuinely different piece of information: not just a number, but how much to trust it. Check back at day five, and if the ensemble has tightened around that same four feet, the swell has gone from promising to close to booked.
That’s the second-week problem GEFS solves. As Rob notes, this is exactly where GFS accuracy tends to fall away fast, and where a single deterministic number starts to look more confident on the page than it deserves to. The truth is that no forecaster, human or model, gets every call right nine days out. What GEFS gives you is a way to see how much to trust the call in front of you, rather than finding out the hard way on the day.

